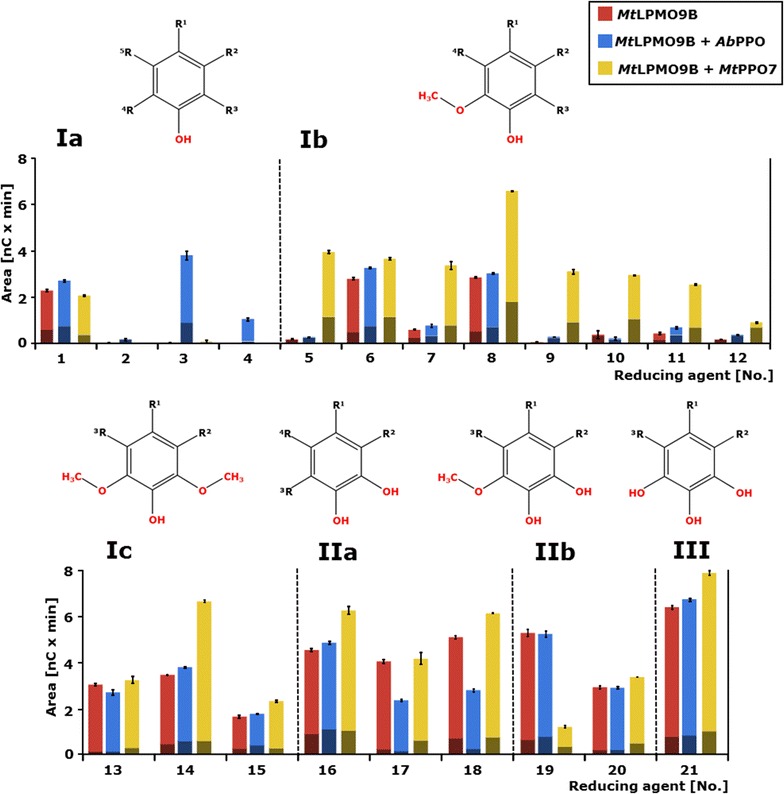
Fig. 2.

RAC incubated with MtLPMO9B with or without MtPPO7 or AbPPO addition in the presence of 21 reducing agents. The numbers are total sums of the integrated peak areas of released non-oxidized (shaded red, blue, and yellow) and C1-oxidized (red, blue, and yellow) gluco-oligosaccharides after incubation of regenerated amorphous cellulose (RAC; 1.5 mg mL−1) with MtLPMO9B only (red bars) (5.0 μg mL−1), MtLPMO9B together with AbPPO (blue bars, 2.5 µL mL−1), or MtLPMO9B together with MtPPO7 (yellow bars) (5.0 μg mL−1) based on HPAEC. The reducing agents (2 mM) are numbered (X-axis) and specified in Table 1. Vertical dotted lines separate the reducing agents into groups (I, II, II) and subgroups (a, b, c). Group I, monophenols (Ia), compounds with a 1-hydroxy,2-methoxy moiety (Ib) or a 1-hydroxy-2,6-dimethoxy moiety (Ic). Group II, compounds with 1,2-benzenediols moiety (IIa) and compounds with a 1,2-dihydroxy-3-methoxy moiety (IIb). Group III, reducing agents with a 1,2,3-benzenetriol moiety (III). All incubations were performed in duplicate and the standard deviations are represented by error bars. See “Methods” for details
