Fig. 7.

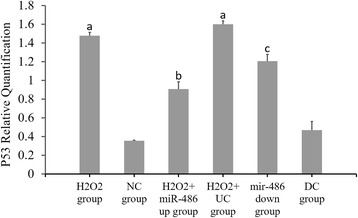
Fluorescence-based quantitative PCR results of p53 mRNA expression. Compared with NC group, a P < 0.05. H2O2 + miR-486 up group compared with H2O2 + UC group, bP < 0.05. miR-486 down group compared with DC group, c P < 0.05

Fluorescence-based quantitative PCR results of p53 mRNA expression. Compared with NC group, a P < 0.05. H2O2 + miR-486 up group compared with H2O2 + UC group, bP < 0.05. miR-486 down group compared with DC group, c P < 0.05