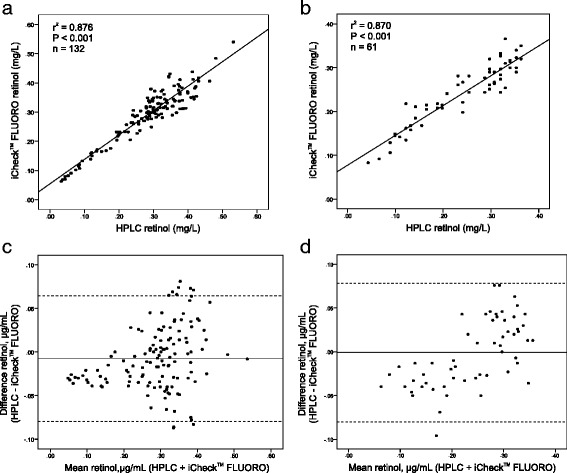
Fig. 1.

Correlation analyses demonstrate close association between plasma retinol as measured by HPLC and iCheck™ fluorometer in lab Germany (a) and lab Japan (b). Bland-Altman plot showing the mean difference (solid line) and the 95% confidence interval (dotted lines) of the retinol values in blood plasma obtained by HPLC and iCheck™ fluorometer in lab Germany (c) and lab Japan (d)
