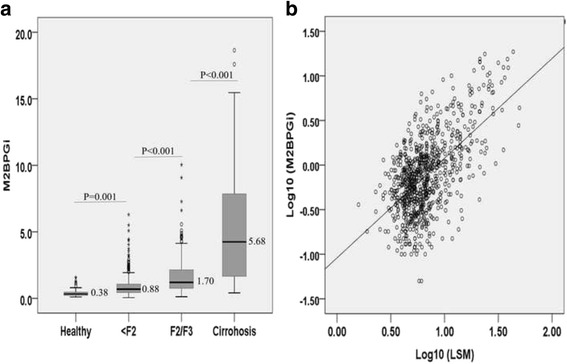
Fig. 1.

a The serum Wisteria floribunda agglutinin-positive Mac-2 binding protein (M2BPGi) values for each fibrosis stage. The top and bottom of each box represent the first and third quartiles, respectively, with the height of the box representing the interquartile range, covering 50% of the values. The line across each box represents the median. The whiskers show the highest and lowest values. b Correlation of log10 (M2BPGi) values with log10 (LSM)
