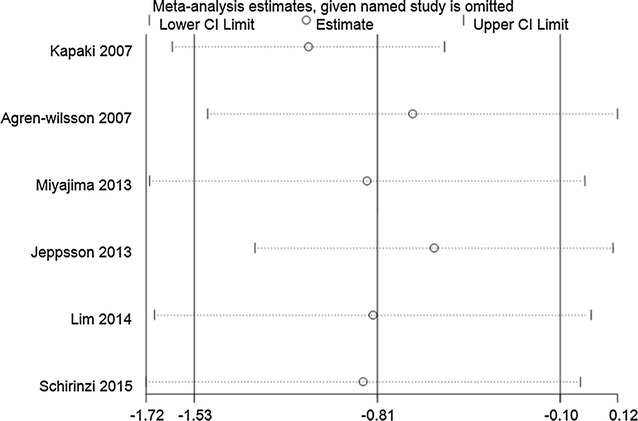
Fig. 5.

Sensitivity analysis of CSF t-tau levels in iNPH compared to healthy controls. Analyses were conducted on the raw data and the pooled estimate was −0.81 (95% CI −1.53 to −0.10). The pooled estimate was different when the study of Agren-Wilsson et al. [12], Jeppsson et al. [25], Lim et al. [27] were omitted separately. The pooled estimates (95% CI) were −0.68 (95% CI −1.47 to 0.12), −0.59 (95% CI −1.29 to 0.11) and −0.83 (95% CI −1.68 to 0.21), respectively. This suggests that results of those between-groups analyses were not stable and reliable
