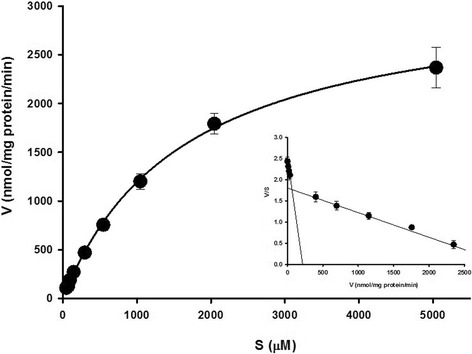
Fig. 2.

Saturation kinetics of [14C]L-citrulline uptake by TR-BBB cells. Uptake of [14C]L-citrulline was measured in TR-BBB cells with 5 min incubation in the presence of 0–5 mM unlabeled L-citrulline at pH 7.4 and 37 °C. The data (insert) are shown as an Eadie-Hofstee plot. The values of v and s represent the initial pseudolinear uptake (nmol/mg protein/min) and L-citrulline concentration (μM), respectively. The data represent the mean ± S.E.M. (n = 3–4)
