. 2014 Sep 23;6(1):95–111. doi: 10.1039/c4sc02571g

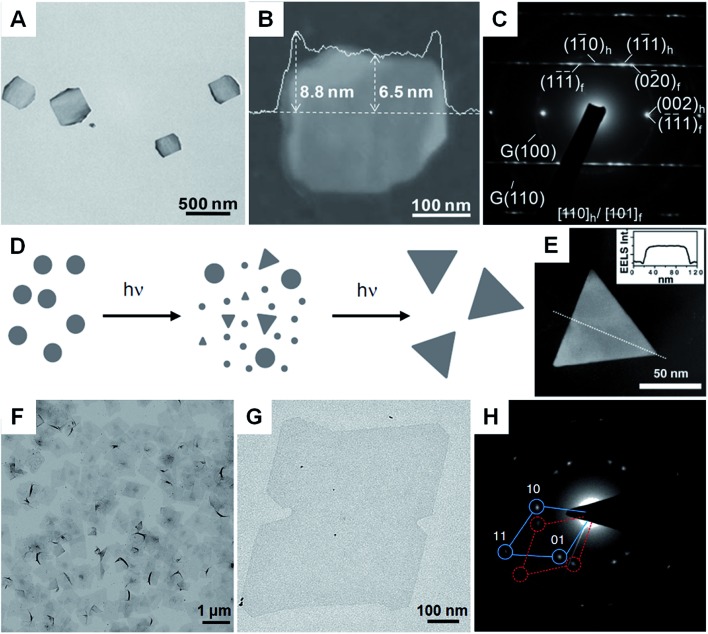
Fig. 3. (A) Bright-field TEM image of hcp/fcc mixed Au square plates.56 (B) AFM image and the corresponding height profile of an Au square plate.56 (C) SAED pattern of an Au square plate taken along the [110]h/[101]f axes.56 Copyright 2011, John Wiley & Sons, Inc. (D) Schematic illustration of the photochemical synthesis of Ag nanoprisms.31 (E) EELS mapping and the corresponding (inset) EELS intensity profile of a typical Ag nanoprism, showing its flat-top morphology.31 Copyright 2001, American Association for the Advancement of Science. (F and G) Bright-field TEM images of Rh nanosheets.27 (H) SAED pattern of Rh nanosheets.27 Copyright 2014, Nature Publishing Group.

Fig. 3