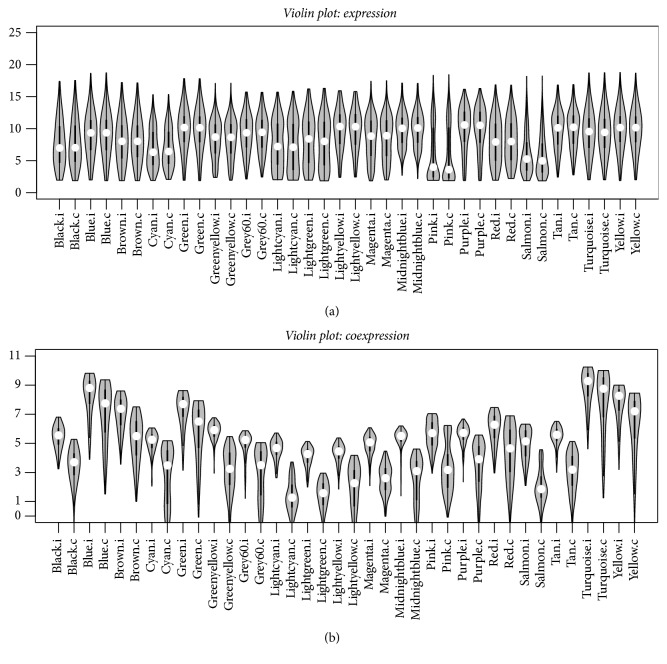
Figure 4.
(a) Violin plot showing the gene expression differences between modules in the infected and control groups. (b) Violin plot showing the gene coexpression connectivity differences between modules in the infected and control groups. .i represents the module in the infected group, and .c represents the module in the control group.

