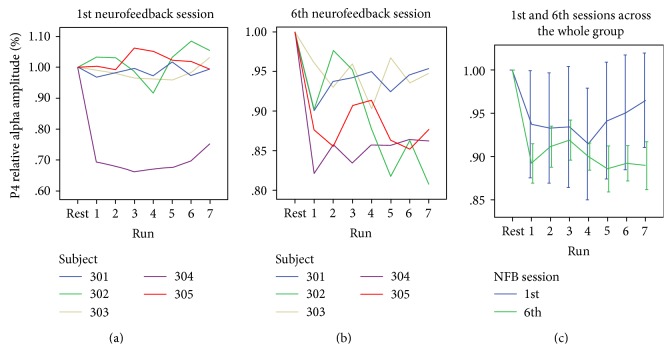
Figure 1.
Alpha amplitude dynamics during the first and last sessions of neurofeedback (NFB) (corresponding to brown slots in Figure S2). Each time point represents data acquired before NFB (rest) and during each NFB run of 3 min (runs 1–7). (a) Individual patient values during the 1st NFB session. (b) Individual patient values during the 6th NFB session. (c) Group (n = 5) means from the 1st (first) and 6th (last) NFB sessions are depicted in green and blue, respectively.

