
Figure 1.
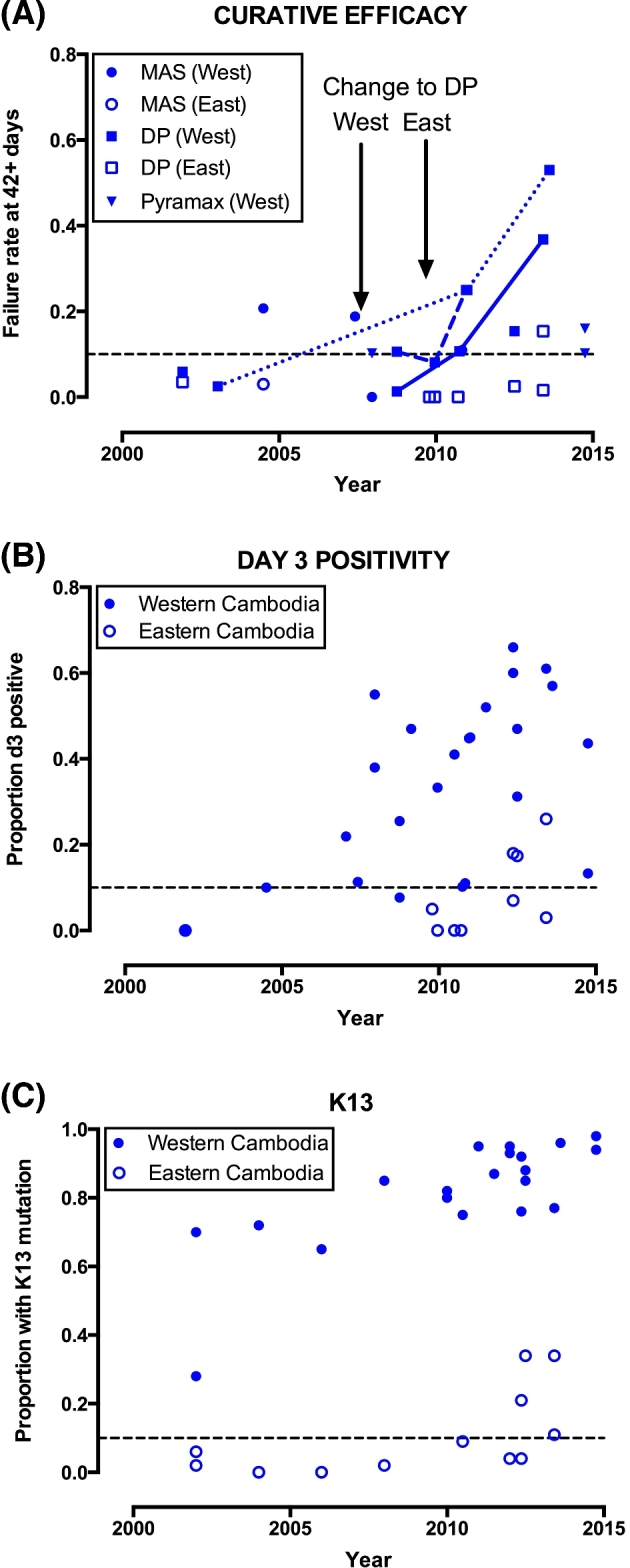
Longitudinal trends in cure rate (A), day 3 positivity (B) and K13 mutation prevalence (C), Cambodia, 2000–2015. In section A (cure rate), connecting lines are drawn for serial studies undertaken in Pursat (normal line), Pailin (dashed) and Oddar Meanchey (dotted) provinces. MAS = artesunate plus mefloquine, DP = DHA-piperaquine, Pyramax = artesunate-pyronaridine. Locations are stratified into western and eastern provinces according to their position with respect to the capital Phnom Penh, in line with previous work (Leang et al.2015). The midpoint of patient recruitment is used as the time point for each study, or half-way through the year if months were not stated. Only studies with n = 20 or more are included. For references see Additional File (Supporting Information).