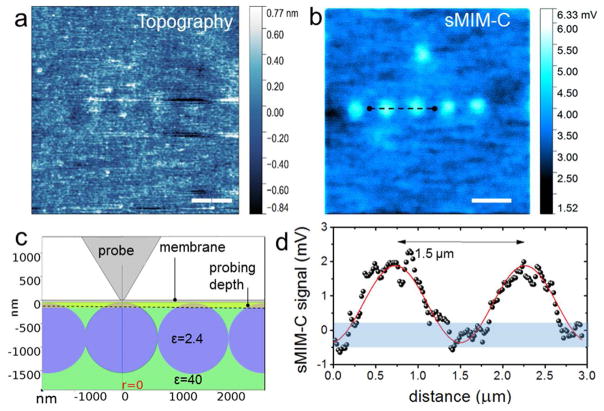
Figure 2. Microwave imaging of a test sample.
a, Height and b, sMIM-C images of polystyrene particles in glycerol closely packed on the backside of a 50 nm-thick SiN membrane. c, Schematic illustrating the determination of the probing depth of the microscope. d, Experimental line profile (circles) and an eye guiding line (red) across the two bright spots in the sMIM-C image in b. The values of the capacitance change were obtained after calibration of the microscope sensitivity, 1.6 aF/mV in this experiment. The shadowed band corresponds to the signal noise level of 0.7 mV defined as root mean square deviation of the output voltage noise multiplied by the calibration factor). Scale bars in a and b are 4 μm.

