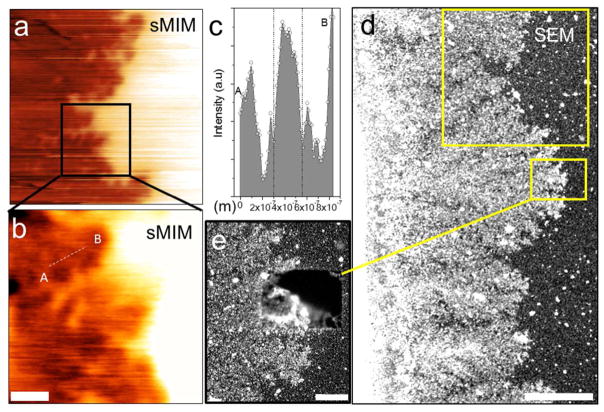
Figure 6.
(a) 12 μm × 12 μm and (b) 5 μm × 5 μm sMIM-C in situ images of the Ag dendrites electrochemically grown at a Ag electrode in a 102 mol/m3 AgNO3 water solution. The images were obtained through a 50 nm SiN membrane. The signal value along the line AB have been selected for resolution evaluation. (c) Full width at half maximum of the signal peak along the line cut AB through two metallic branches of a dendrite in (c) is approximately 250 nm. (d) The same area as in (a) imaged using SEM. Scale bar corresponds to 5 μm. The electron beam energy was set to 15 keV. (e) Electron-beam-induced dissolution/delamination of Ag deposit from the backside of the membrane. Scale bar corresponds to 1 μm.

