
Figure 7. In vivo targets affected by loss of Snf5 both overlap and are distinct from that of Snf2.
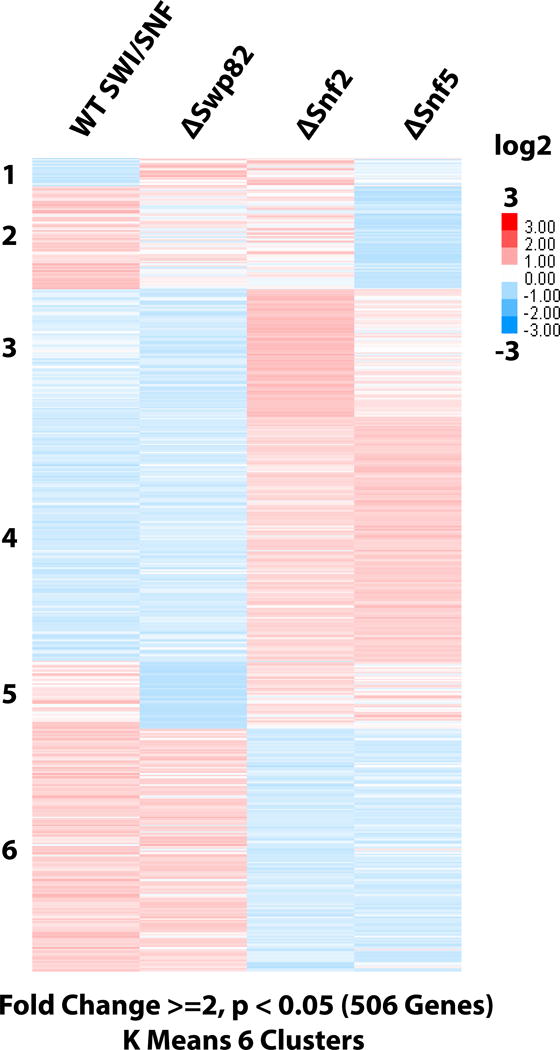
(A) RNA-seq heat map depicts those genes with fold change >= 2 in expression (506) and satisfy the parameters of a p < 0.05. Genes were grouped into 6 clusters using k-Means clustering. A total of 5,935 genes were analyzed.