
Figure 2.
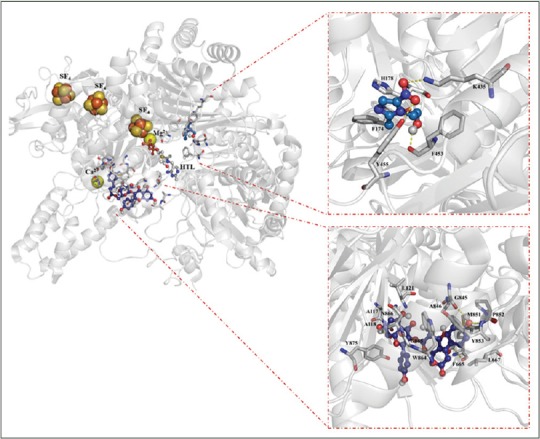
Inhibition sites over pyruvate:ferredoxin oxidoreductase to tiliroside and metronidazole (left panel). Close contact of the binding modes of metronidazole (upper right panel) and tiliroside (lower right panel). H bonds are showed in red dashes. Y = Tyr; W = Trp, G = Gly, N = Asn, L = Leu, M = Met, A = Ala, P = Pro, F = Phe, H = His, K = Lys. SF4= [4Fe-4S] cluster