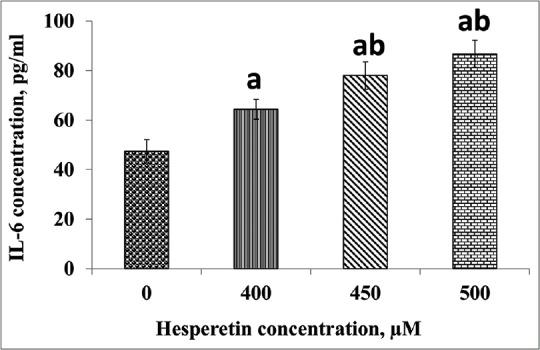
Figure 7.

The levels of interleukin-6 after treatment with hesperetin in PC3 cells which were significantly elevated compared with the control cells. PC3 cells were treated with different concentrations of hesperetin for 48 h and secreted interleukin-6 was measured by ELISA. Data represent the mean ± standard deviation value of three consecutive experiments. aP < 0.05 compared to the control cells. bP < 0.05 compared to 400 μM treated cells with hesperetin
