Figure 2.

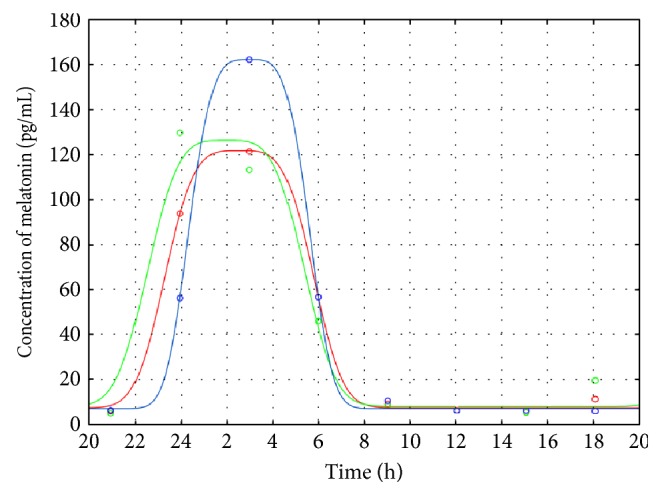
The average melatonin profiles for TSC-G (blue line), E-G (red line), and C-G (green line) obtained from the medians of the parameters. Median data points of specific time intervals are shown as colored circles.

The average melatonin profiles for TSC-G (blue line), E-G (red line), and C-G (green line) obtained from the medians of the parameters. Median data points of specific time intervals are shown as colored circles.