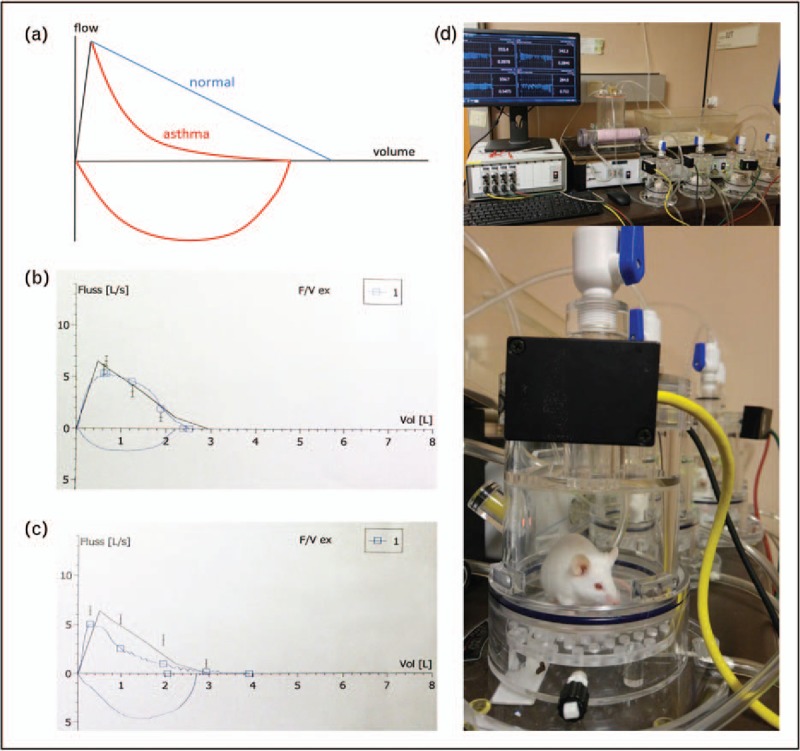
FIGURE 1.

Spirometry: principle and typical test results. (a) Diagram showing the changes in airflow in healthy (blue) and asthmatic condition (red) (Adapted from [43]; (b) original spirometry test results of a human healthy patient; (c) of a patient suffering from bronchial asthma. Note the reduced airflow (upper blue line) due to bronchoconstriction above the x-axis in (c), as compared with normal lung function in (b); y-axis: forced expiratory flow (FEF) in l/s; x-axis: expired air volume in liters; (d) whole-body plethysmography in mouse studies for asthma research (d1, series of measurements in mice; d2, single tested mouse). The experimental principle is identical to the human diagnostic test. Reproduced with permission from Springer [39].
