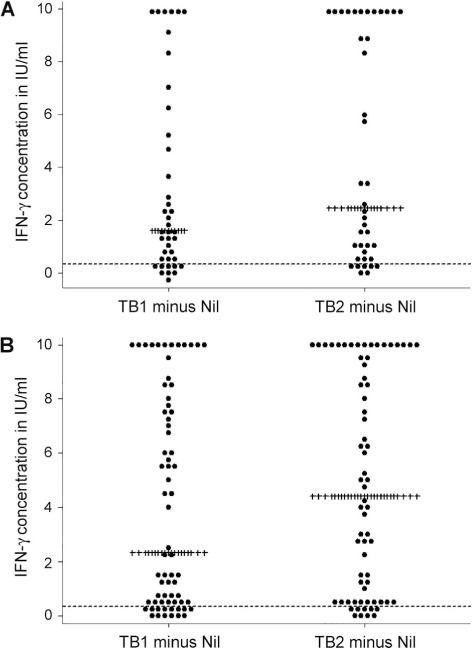
Figure 2.

Dot plot of TB1 and TB2, minus the nil background IFN-γ concentration among pulmonary TB patients tested using the QuantiFERON®-TB Gold Plus assay, stratified by HIV status (n = 108 with known HIV status). A) HIV-negative pulmonary TB patients (n = 40); B) HIV-positive pulmonary TB patients (n = 68). Each dot represents the TB1 minus the nil background IFN-γ concentration (on the left) and the TB2 minus the nil background IFN-γ concentrations (on the right), per person. ------ = IFN-γ concentration of 0.35 IU/ml; ++++ = median IFN-γ concentration in IU/ml. IU = international unit; IFN-γ = interferon-gamma; TB = tuberculosis; HIV = human immunodeficiency virus.
