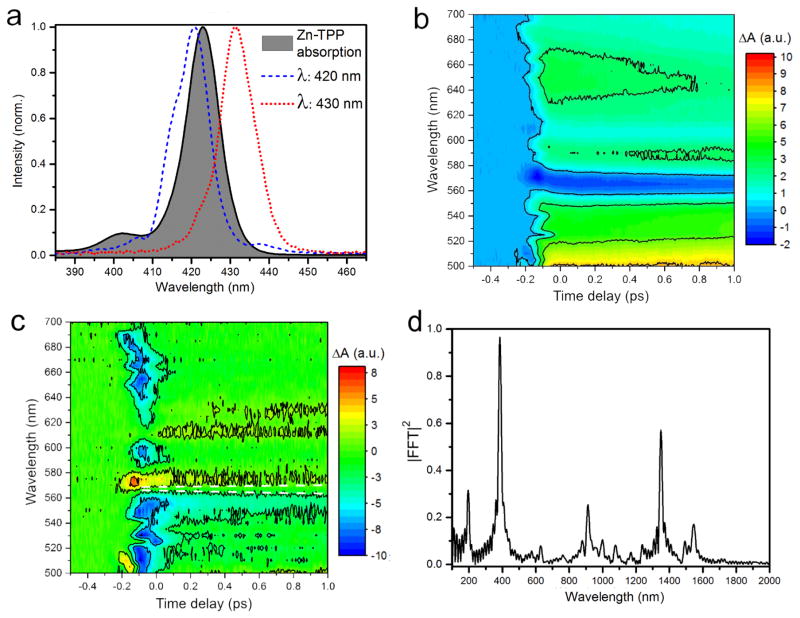
Figure 1.
a) Ground state spectrum of Zn-TTP Soret band absorption and spectra of actinic pump pulses. b) TA map of Zn-TPP after excitation at 420 nm. c) TA difference map between (b) and a map recorded after 430 nm excitation on the red side of the Soret band (Figure S6). The dashed lines are guides to the eye. A vertical line would be indicative of repopulation between states, a sloped line would indicate a peak shift. d) Ground-state state resonant pump-DFWM spectrum.

