
Figure 9.
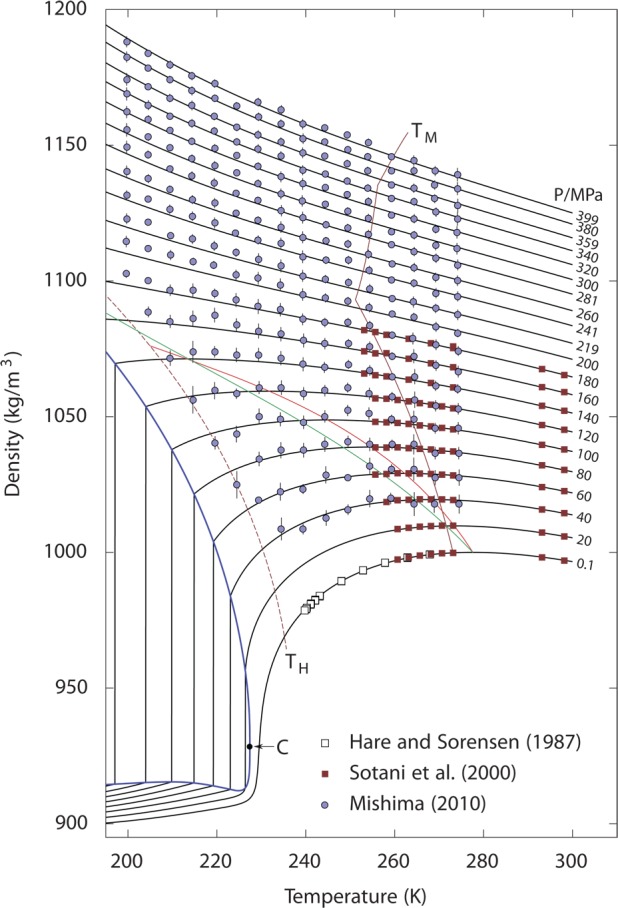
Density of cold and supercooled water as a function of temperature along isobars. Reproduced with permission from ref (39). Copyright 2012 MacMillan Publishers. Symbols represent experimental data.71,168,169 Black curves are the predictions of the two-state model.39TM (dark red) indicates the melting temperature, and TH indicates the homogeneous nucleation temperature. The thick blue line is the predicted liquid–liquid equilibrium curve, with the critical point C. The red line is the line of maximum density, and the green line is the line of a constant LDL fraction of about 0.12.