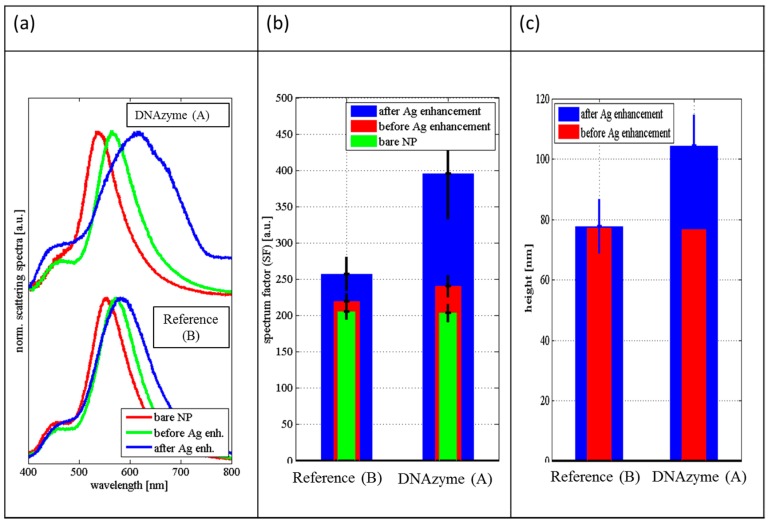
Figure 2.
Spectral and microscopic characterization of the Ag deposition on AuNPs for experiments A and B (Scheme 1). Panel (a) shows normalized scattering spectra of two representative NPs during the consecutive steps of silver enhancement procedure for NP with attached DNAzyme (top) and for NP without DNAzyme (bottom). Bare NP (red line), NP just before Ag enhancement reaction (green line), after Ag enhancement (blue line). Scattering spectra for other NPs are shown in Figures S1 and S2 in Supplementary Materials. Panel (b) presents values of the spectrum factor (SF) for the spectra of the NPs with and without DNAzyme during the process of the silver deposition. Panel (c) shows values of the average height of NPs before Ag enhancement reaction and after Ag deposition for NPs with DNAzyme and without DNAzyme (reference probe). The height was measured by atomic force microscopy. The AFM images are shown in Figures S4 and S5 in Supplementary Materials.

