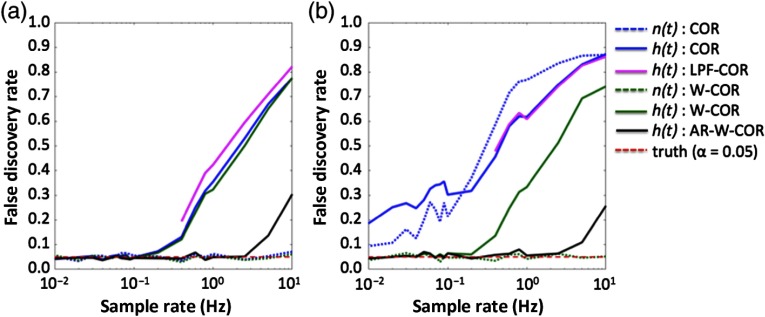
Fig. 3.
Comparison of FDR in simulated data as a result of sample rate. This figure shows the FDR for simulated “neural” and “hemodynamic” signals at different sampling rates and for the various correlation models described in Sec. 3.2. The expected FDR () is shown in the dotted red line. Estimates above this line are considered uncontrolled type-I errors. These simulations are described in Sec. 3.1.1. The abbreviations of the methods are defined in Sec. 3.2. (a) Without motion artifacts and (b) with motion artifacts.

