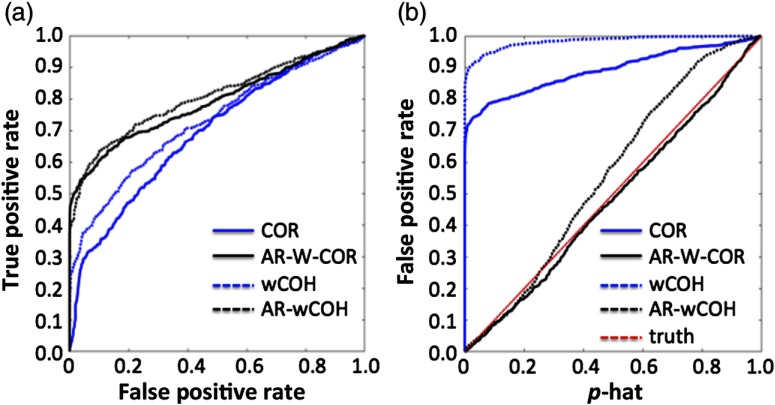
Fig. 7.
Comparison of sensitivity–specificity and control type-I error in experimental data. (a) Comparison of the performance of the unwhitened and prewhitened COR and wCOH models using the experimental data described in Sec. 3.1.3. (b) Control for type-I errors for the same data and methods. In panel (b), idealized control for type-I error is indicated by a line of unity slope (red dotted line). The abbreviations of the methods are defined in Sec. 3.2.

