
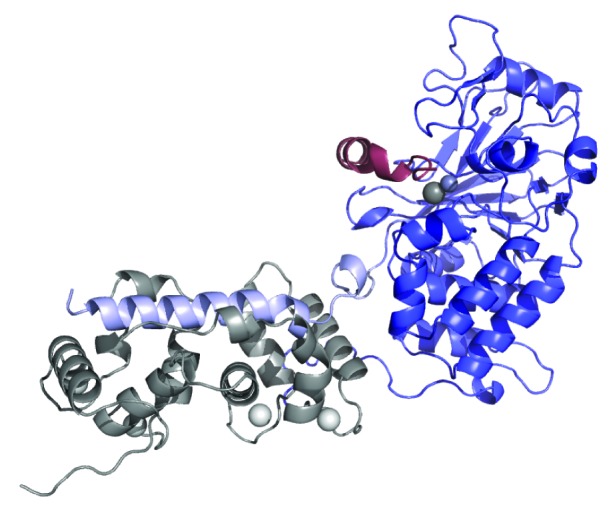
Figure 2. Ribbon diagram of CaN crystal structure (PDB ID 1AUI).36 CnA catalytic domain shown in blue, BBH in lilac, and AID in red. Catalytic Zn-Fe pair shown as mid-gray balls. First 16 residues of CnA, RD, and CT were missing from electron density and are not shown. CnB chain shown in gray with bound calcium ions depicted as white balls.