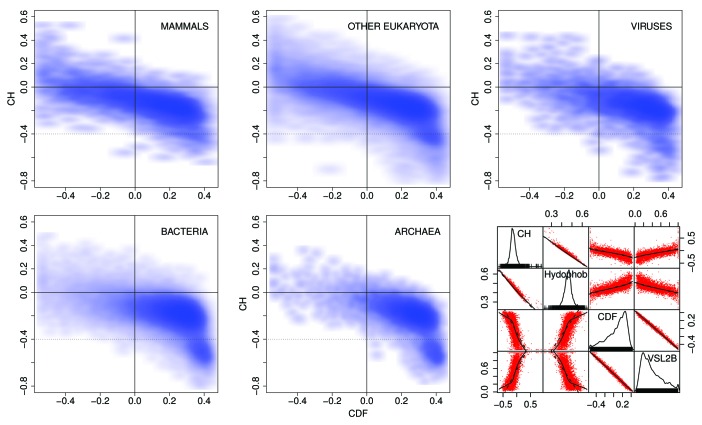
Figure 5. CH/CDF plots34 for mammals, other eukaryota, viruses, bacteria, and archaea. The scatterplot matrix (bottom right) shows density (number of sequences) as a function of CH, hydrophobicity,35 CDF, and VSL2b,36 while the off-diagonal plots show the correlations between each of these parameters. The off-diagonal plots: (1) corresponding to CH/CDF on the diagonal duplicate the plot for all Pfam seed sequences for Mammals (top left), and (2) corresponding to CH or CDF on the one hand and hydrophobicity or VSL2b on the other, show the high correlation between CH and hydrophobicity, and between CDF and VSL2b. Only 2 or 3 clearly separate clusters are evident here, but the cluster analyses of the Mammalian data, shown in Figures 9‒15 reveal much more information.

An official website of the United States government
Here's how you know
Official websites use .gov
A
.gov website belongs to an official
government organization in the United States.
Secure .gov websites use HTTPS
A lock (
) or https:// means you've safely
connected to the .gov website. Share sensitive
information only on official, secure websites.
