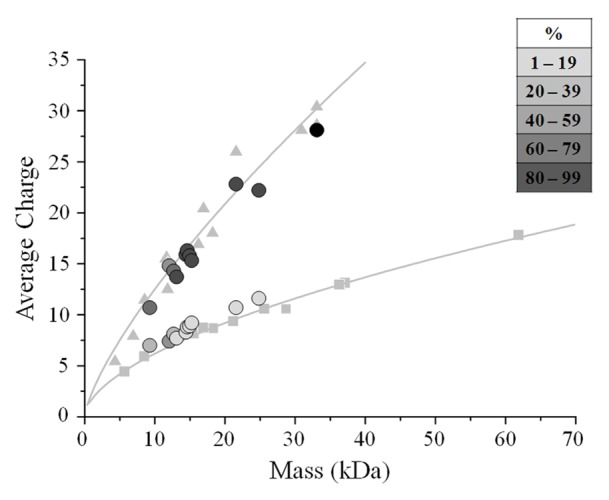
Figure 2. Charge-to-mass plot for distinct components of some IDPs analyzed by non-denaturing ESI-MS. In the case of bimodal distributions, each component is represented by a circle, colored according to the relative abundance as specified in the inserted table. For unimodal distributions (unique case of full-length Sic1), the global average charge is considered and the symbol is colored in black. The gray small squares and triangles represent data for globular proteins, respectively under non-denaturing and denaturing conditions. The gray lines are interpolations by power-law functions.
