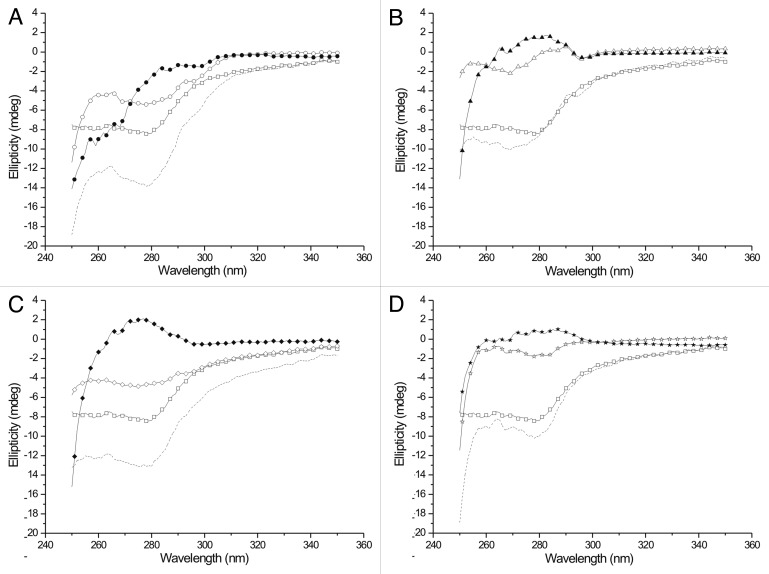
Figure 3. Near UV CD spectra of Tß4 and its partners. Tß4 is labeled with open squares and the algebraic sum of the spectra of the separated partners is labeled with dashed line on every panel. (A) interaction with PINCH LIM4-5. ○: PINCH LIM4-5 in the absence of Tß4; ●: complex of PINCH LIM4-5 and Tß4. (B) interaction with ILK-Ank-GST. △: ILK-Ank-GST in the absence of Tß4; ▲: complex of ILK-Ank-GST and Tß4. (C) interaction with PINCH LIM4-5 and ILK-Ank-GST. ◇: 1:1 mixture of PINCH LIM4-5 and ILK-Ank-GST; ◆: complex of PINCH LIM4-5, ILK-Ank-GST and Tß4. (D) interaction with Stabilin CTD. ☆: stabilin CTD in the absence of Tß4; ★: complex of stabilin CTD and Tß4.

An official website of the United States government
Here's how you know
Official websites use .gov
A
.gov website belongs to an official
government organization in the United States.
Secure .gov websites use HTTPS
A lock (
) or https:// means you've safely
connected to the .gov website. Share sensitive
information only on official, secure websites.
