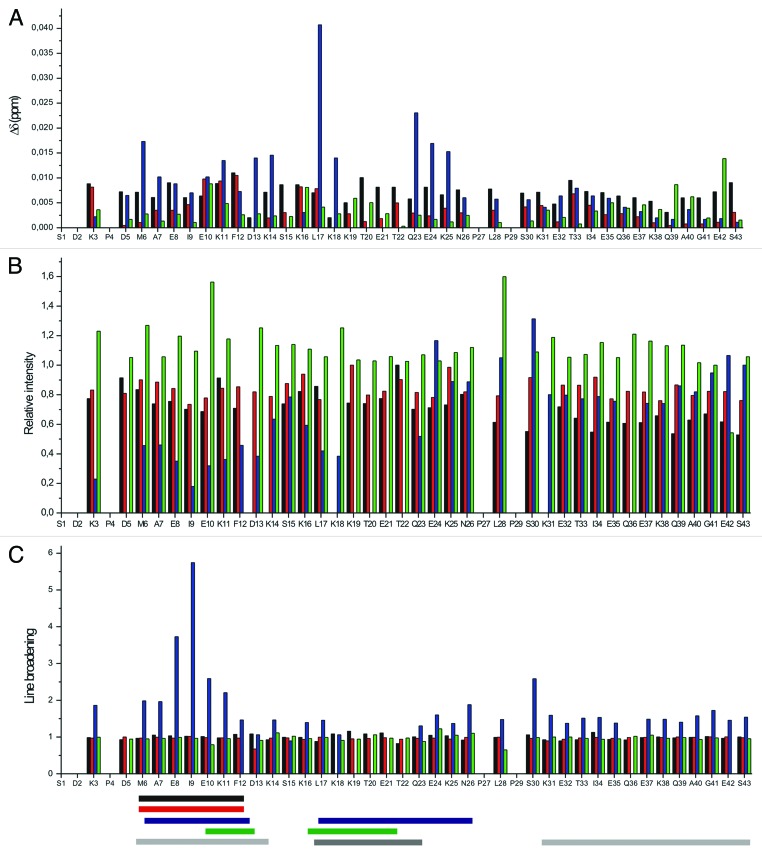
Figure 6. Residue mapped perturbation based on amide combined chemical shift changes during interaction between tβ4 and its partners screened by 1H-15N-HSQC spectra seen on Figure 5 (A). (Note: D13/K18 and K14/K31 overlays.) (B) Relative intensity changes observed during the interaction between tβ4 and its partners. (C) Line broadening of the signals on the 1H-15N-HSQC spectra during the interaction between tβ4 and its partners. Black: interaction with PINCH LIM4-5; red: interaction with ILK-Ank-GST; blue: interaction with PINCH LIM4-5 and ILK-Ank-GST together; green: interaction with stabilin CTD. Horizontal bars represent the regions that primarily take part in the interaction with the specific partner. Black: PINCH LIM4-5; red: ILK-Ank-GST; blue: PINCH LIM4-5/ILK-Ank-GST; green: stabilin CTD; light gray: the 2 α helices that are formed upon G-actin binding; gray: the region important for matrix metalloproteinase activation.

An official website of the United States government
Here's how you know
Official websites use .gov
A
.gov website belongs to an official
government organization in the United States.
Secure .gov websites use HTTPS
A lock (
) or https:// means you've safely
connected to the .gov website. Share sensitive
information only on official, secure websites.
