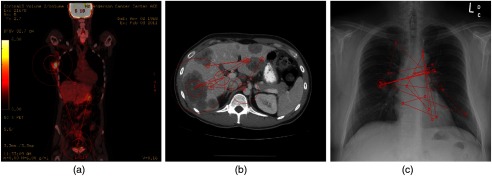
Fig. 1.
Example gaze maps generated from one of the radiologist’ eye-position recorded when reading (a) PET, (b) CT, and (c) CXR images. The red circles are fixations, with the radius representing the corresponding dwell time of the fixation. Connecting red lines are saccades between two consecutive fixations.

