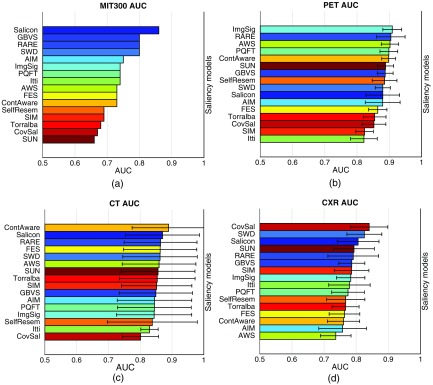
Fig. 4.
Bar graphs of the AUC scores achieved by the saliency models. The models are shown in the descending order of the mean AUC score. Each model is indicated by a unique color to facilitate color pattern assessment across the four subfigures. The ranking listed on the MIT saliency benchmark serves as the reference of the colors of the models. (a) The AUC scores with the MIT300 dataset. No standard deviation of AUC is reported on the benchmark. (b) The AUC scores with the PET images. (c) The AUC scores with CT images, (d) The AUC scores with the CXR images. Visually, it is obvious that the rank orders of the models are significantly different across the four subfigures.

