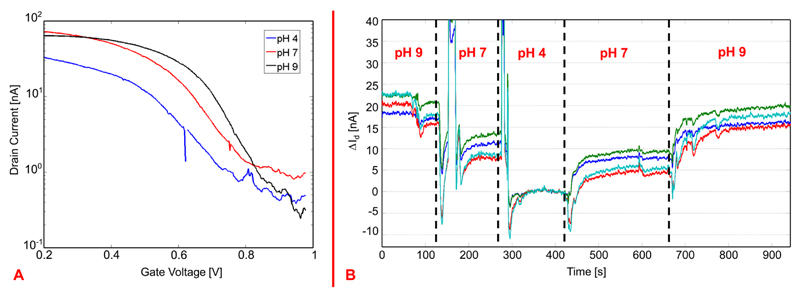
Figure 4.
(A) Measured drain currents (plotted in log scale) of one SiNW FET as a function of the gate voltage, i.e., voltage applied to the reference electrode in the liquid solution, for different pH values. The plot shows the threshold voltage shifts induced by the pH changes. (B) Drain current changes versus time as a function of different pH values as measured simultaneously from 4 SiNWs; the current measured at pH 4 is taken as the zero level, and the current differences, ΔId, in reference to the current values at pH 4 are plotted.

