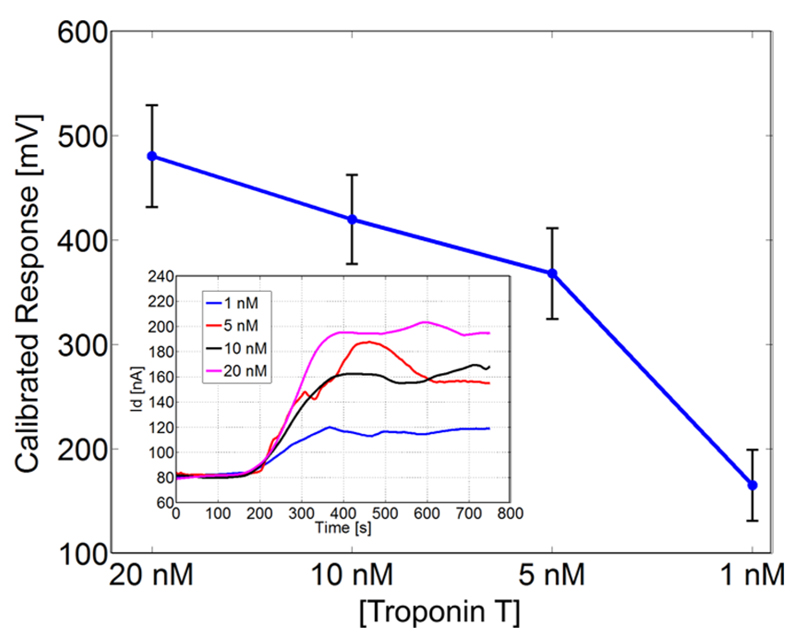
Figure 5.
Average calibrated response with standard deviation (error bars) measured for 10 nanowires upon injection of different concentrations of human cardiac troponin T (cTnT). Inset: Drain current changes versus time as a function of different cTnT concentrations for one nanowire. The initial value was measured during injection of only sensing buffer (0.1 mM PBS at pH 8.4); each protein concentration was injected at 120s.

