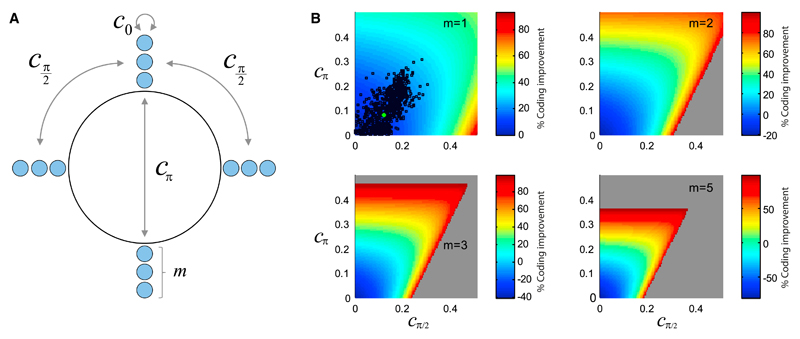
Figure 7. Effect of Correlation in Small Populations of Direction-Selective Neurons.
(A) Illustration of the model of direction-selective neurons, for a given stimulus, in which there are m neurons whose preferred directions point along each of the four cardinal directions. The correlation structure is parametrized by c0, cπ/2, and cπ, the values of correlations in pairs of neurons whose preferred directions differ by 0°, 90°, and 180°.
(B) Profiles of the percent improvement in coding accuracy as functions of cπ/2 and cπ, for different values of m; in the cases m = 2, 3, and 5, c0 was set to 0.2, comparable to the observed values. Black dots represent the values observed in the data; the green dot represents the average over all data. The gray area represents forbidden values of the correlations (with negative eigenvalues of the covariance matrix).

