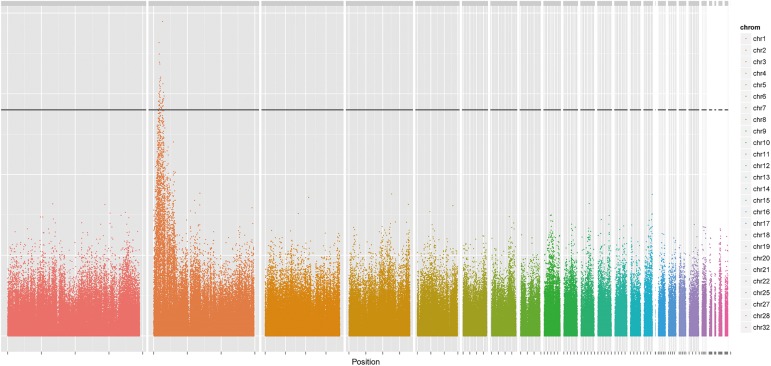
Fig 2. Genome-wide scan for polydactyly in the Beijing fatty chicken.
Manhattan plot showing the association of all SNPs with the phenotype of polydactyly. Chromosomes 1–32 are shown in different colors. The black solid line indicates a significant association with a P-value approximately equal to 1.009e-07, a value with a Bonferroni correction below 0.05.

