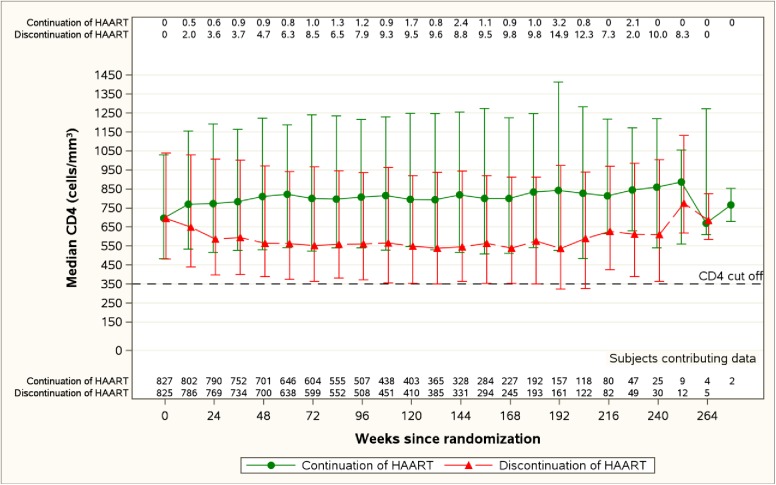
Fig 3. CD4 Cell Counts Over time (Median, 10th and 90th percentile, and the proportion <350 cells/mm).
The median CD4 cell counts in the continue (green) and discontinue (red) arms are show at each follow-up visit. The proportion with a CD4 count below 350 cells/mm3 are shown across the top of the figure at each timepoint.

