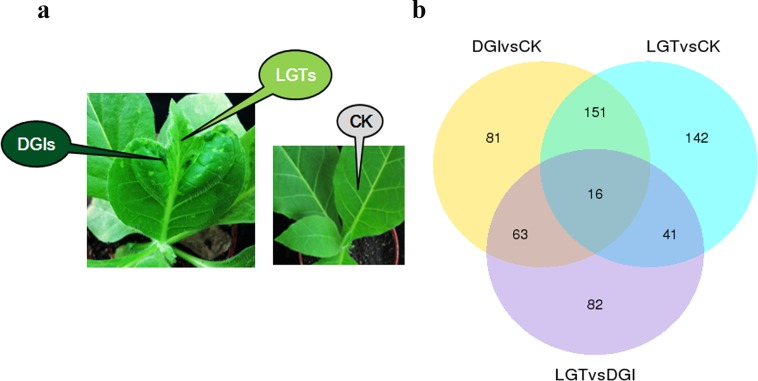
Fig 1.
(a) Symptoms of N. tabacum leaves systemically infected with CMV. CK, N. tabacum were mock inoculated with phosphate buffer; DGI, dark green tissues of CMV-infected N. tabacum; LGT, light green tissue of CMV- infected N. tabacum; (b) Venn diagram of DEGs between three comparisons (DGI vs. CK, LGT vs. CK and LGT vs. DGI). The sum of the numbers in each large circle represents total number of differentially expressed genes between combinations, the overlap part of the circles represents common differentially expressed genes between combinations.

