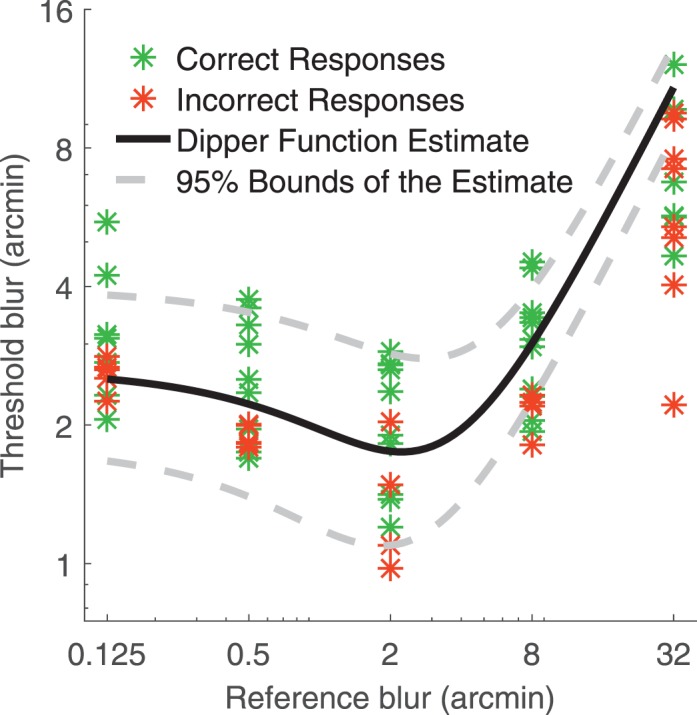
Figure 3.

Example of a dipper function estimated for one representative observer in the binocular, 0° eccentricity condition. Asterisks represent individual trials: Green and red are correct and incorrect responses, respectively. Black curve is the estimated dipper function describing how the observer's threshold blur increment varies as a function of reference blur. Note that in this 4AFC task, 25% trials below threshold are guessed correctly (green asterisks). Dotted lines are the 95% bounds of the estimated curve.
