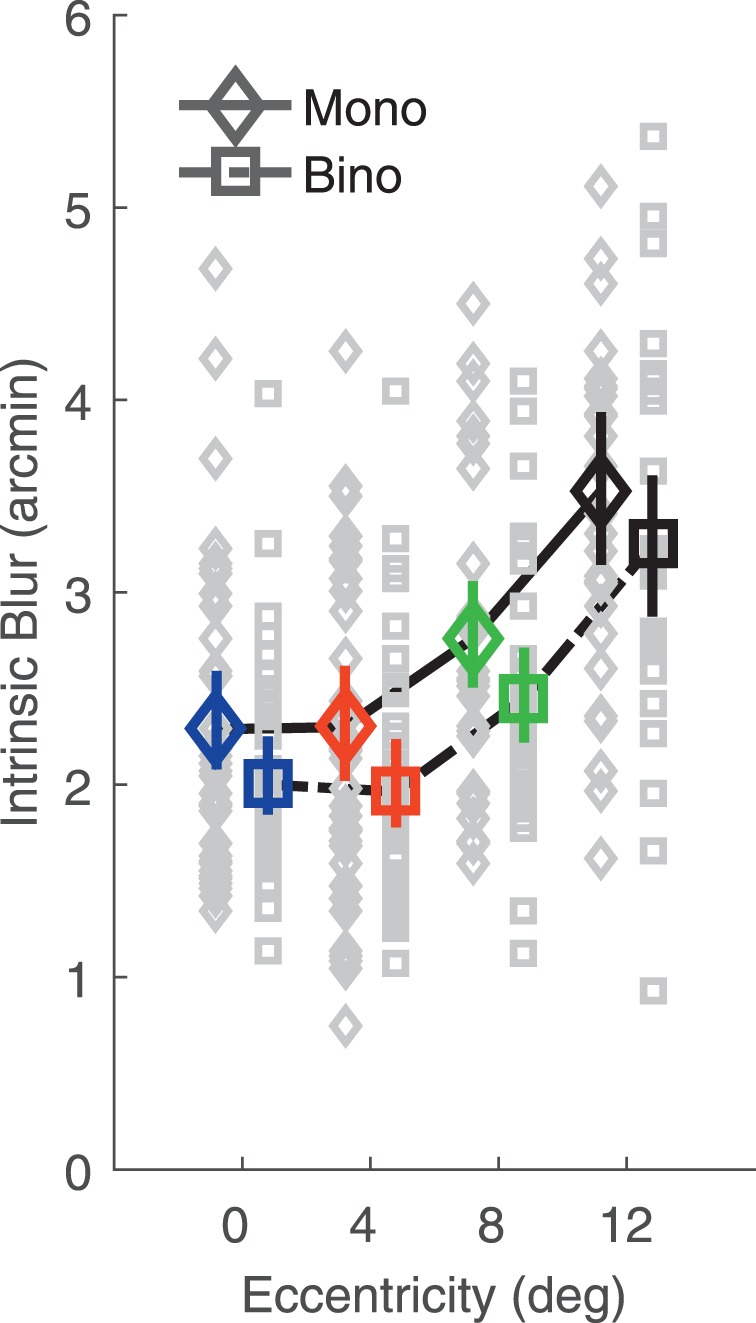
Figure 5.

Intrinsic blur as a function of eccentricity in monocular and binocular viewing. Data are averaged across subjects for both monocular (diamonds) and binocular (squares) viewing conditions. Color-coding of eccentricity conditions is as in Figure 3. Error bars are 95% bootstrapped confidence intervals of the mean. Gray data points are individual subject data. Monocular and binocular data are shifted left and right for graphical purposes.
