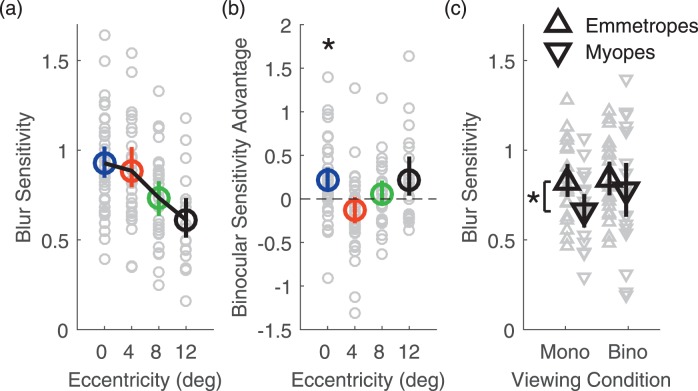
Figure 6.
Blur sensitivity. (a) Blur sensitivity as a function of eccentricity averaged across subjects and viewing conditions. (b) Blur sensitivity advantage for binocular viewing compared with monocular viewing as a function of eccentricity averaged across all subjects. Color-coding of eccentricity conditions in (a) and (b) is as in Figure 4. (c) Monocular and binocular blur sensitivity in emmetropes (upwards pointing triangles) and myopes (downward pointing triangles). Data are averaged across eccentricities and across subjects in each refractive group. Error bars are 95% bootstrapped confidence intervals of the mean. Gray data points are individual subject data. *p < 0.05.

