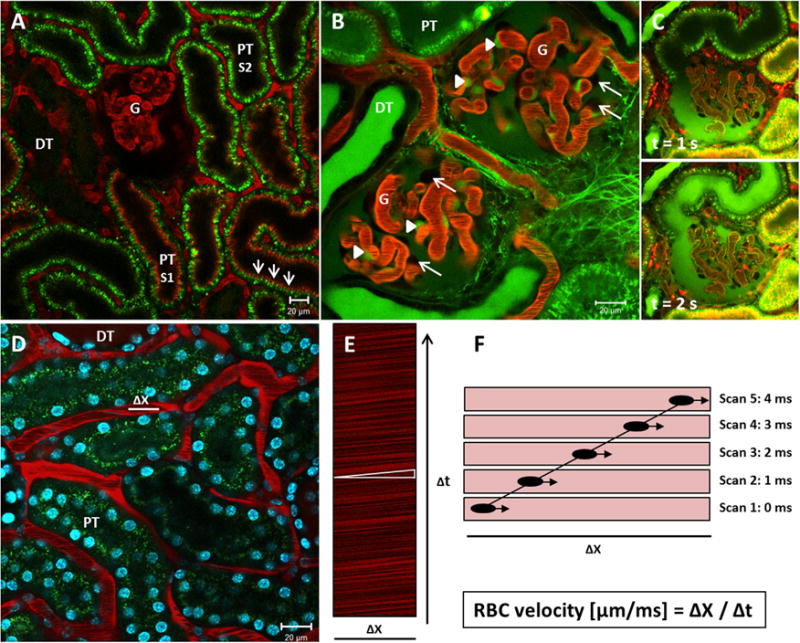
Figure 1.

Intravital MPM to study renal function and morphology. (A) Intravital MPM can be used to visualize common renal structures, such as the glomerulus (G), the proximal tubule (PT), and the distal tubule (DT). Images were obtained in a MWF rat. The glomerular and peritubular vasculature is stained red by Alexa 594-albumin, which is barely filtered in the kidneys. Proximal tubules show an intense autofluorescence owing to the high density of NADH-rich mitochondria. S1-PT segments can be distinguished from S2-PT segments by the high uptake of Alexa 594-albumin in the brush border (arrows). Distal tubules show minimal autofluorescence. (B) A continuous infusion of the small-molecular-weight dye, LY, can be applied to show mesangial cells and podocytes. LY is freely filtered into Bowman’s space and therefore stains the urinary space green. Mesangial cells (arrowheads) endocytose LY over time and turn a bright green color. Podocytes (arrows), on the contrary, are excluded from any staining and appear as dark unstained objects at the outer margins of the capillary loops. (C) Intravital MPM can be used to visualize glomerular filtration. Upper and lower panel are images that were extracted from a time series during a bolus injection of LY. Upper panel: The LY is readily filtered into Bowman’s space (green) after the injection, but has not yet reached the urinary pole and the proximal tubule of the same nephron. Lower panel: A second later, the injected LY has streamed down the first segment of the proximal tubule. (D) Image of the renal cortex of a BL6 mouse. Cell nuclei are stained blue by the injection of the cell membrane-permeable dye Hoechst 33342, which binds to DNA. Alexa 594-albumin stains the plasma red, while the RBCs are excluded from the staining and appear as black bands in the lumen while streaming down the capillary. Within a peritubular capillary, a 20-μm longitudinal distance Δx in the central axis is subject to repetitive scans over time Δt. (E) This so-called linescan results in an XT image, in which the movement of the RBCs leaves dark diagonal bands. The slope of these bands (white triangle) is inversely proportional to the velocity of the RBCs. (F) Schematic explanation of the generation of a linescan. The same distance Δx is scanned several times. During the first scan, a RBC is captured in a certain position while streaming down the capillary. During the second scan, which occurs 1 ms later, the same RBC has moved further along the scanned distance. Accordingly, the movement of the RBC can be traced within the following linescans. One diagonal dark band emerges by several scans and indicates the time Δt in which the RBC covered the distance Δx. The velocity of the RBC (μm/ms) is calculated as Δx/Δt.
