
Figure 1.
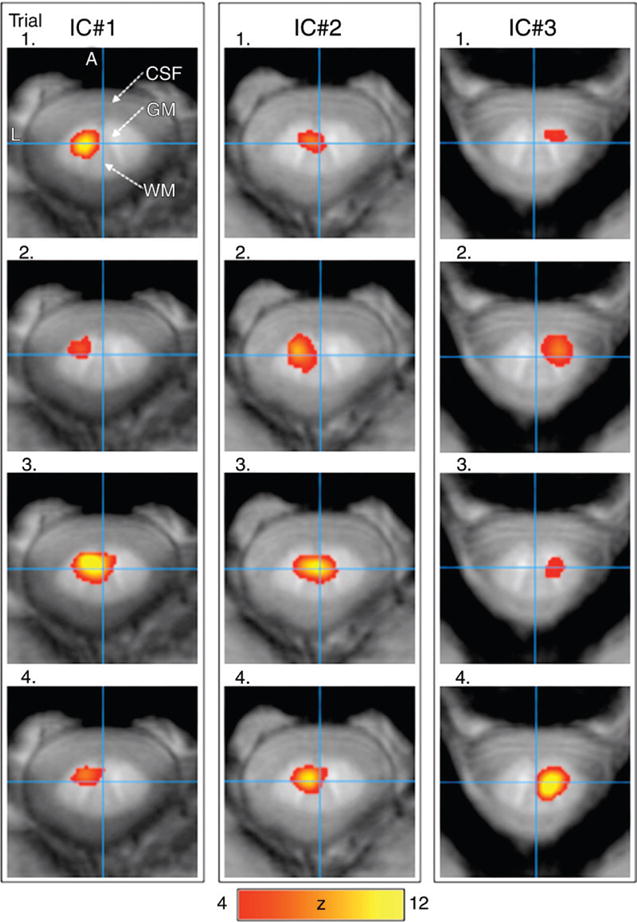
Three ICs of the resting-state functional MR imaging maps from four repeated trials in one subject were overlaid on susceptibility images of the C1—C4 vertebrae. The maps were consistent across four trials. Scale bar = z scores. A = anterior, CSF = cerebrospinal fluid, GM = gray matter, L = left, S = superior, and WM = white matter.