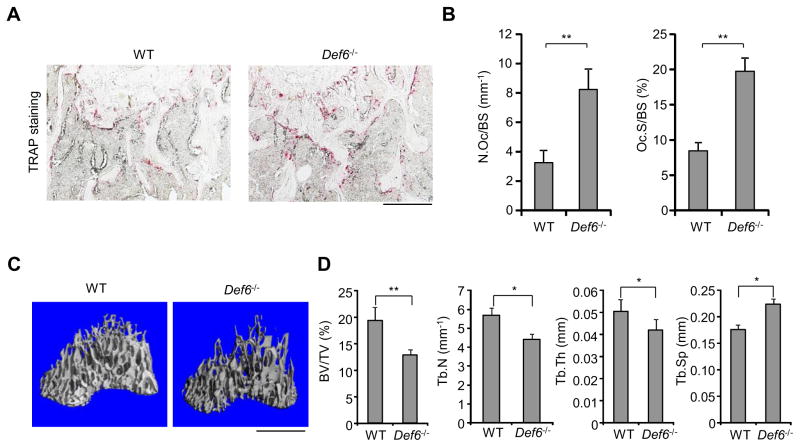
Figure 2. Def6−/− mice exhibit osteoporotic phenotype and enhanced osteoclast formation.
(A) TRAP staining and (B) histomorphometric analysis of the histological sections obtained from the metaphysis region of distal femurs of the twelve week old male Def6−/− mice and their littermate control mice, N. Oc./BS, number of osteoclasts per bone surface; Oc. S/BS, osteoclast surface per bone surface. n = 5 per group. **p < 0.01. Scale bar: 100 μm. Microcomputed tomography (μCT) images (C) and the bone morphometric analysis (D) of trabecular bones of the distal femurs isolated from the twelve week old male Def6−/− mice and their littermate control mice. Scale bar: 1 mm. BV/TV, bone volume per tissue volume; Tb. N, trabecular number; Tb. Th, trabecular bone thickness; Tb. Sp, trabecular bone spacing. n = 5 per group. *p < 0.05; **p < 0.01.

