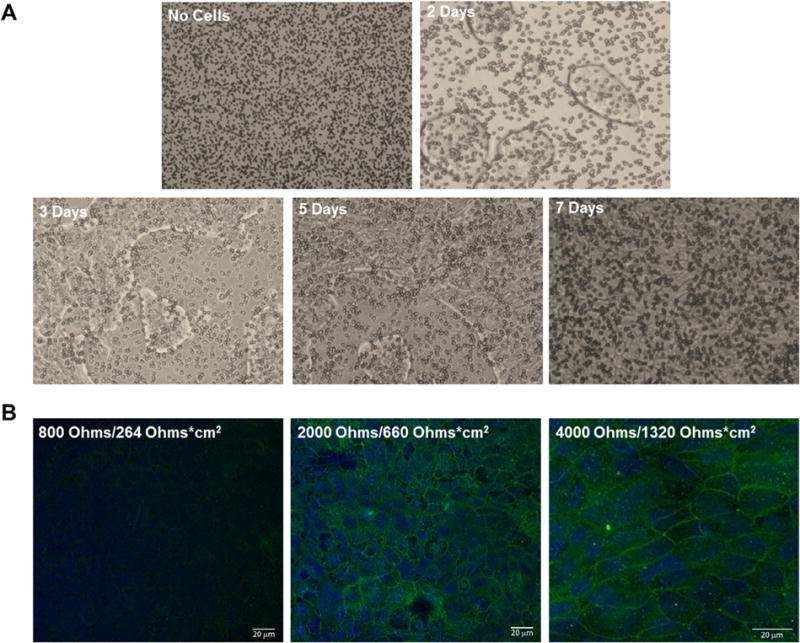
Fig. 2.

Microscopic imaging of cultured Calu-3 cells from seeding to confluent monolayer formation. (A) Calu-3 monolayer formation at 2, 3, 5, and 7 days in culture, plated in medium supplemented with 10% FBS on Transwell inserts, was imaged using an inverted microscope at 10× magnification. Transwell insert pores can be visualized in the absence of cells (top left panel), while monolayer formation can be seen over time (remaining panels) with the addition of cells. (B) Confocal microscopy revealed tight junction complexes (ZO-1, green) and nuclei (DAPI, blue) of the Calu-3 cell monolayer at the indicated electrical resistances. The observed ZO-1 fluorescent intensity increases as electrical resistance increases. (For interpretation of the references to colour in this figure legend, the reader is referred to the web version of this article.)
