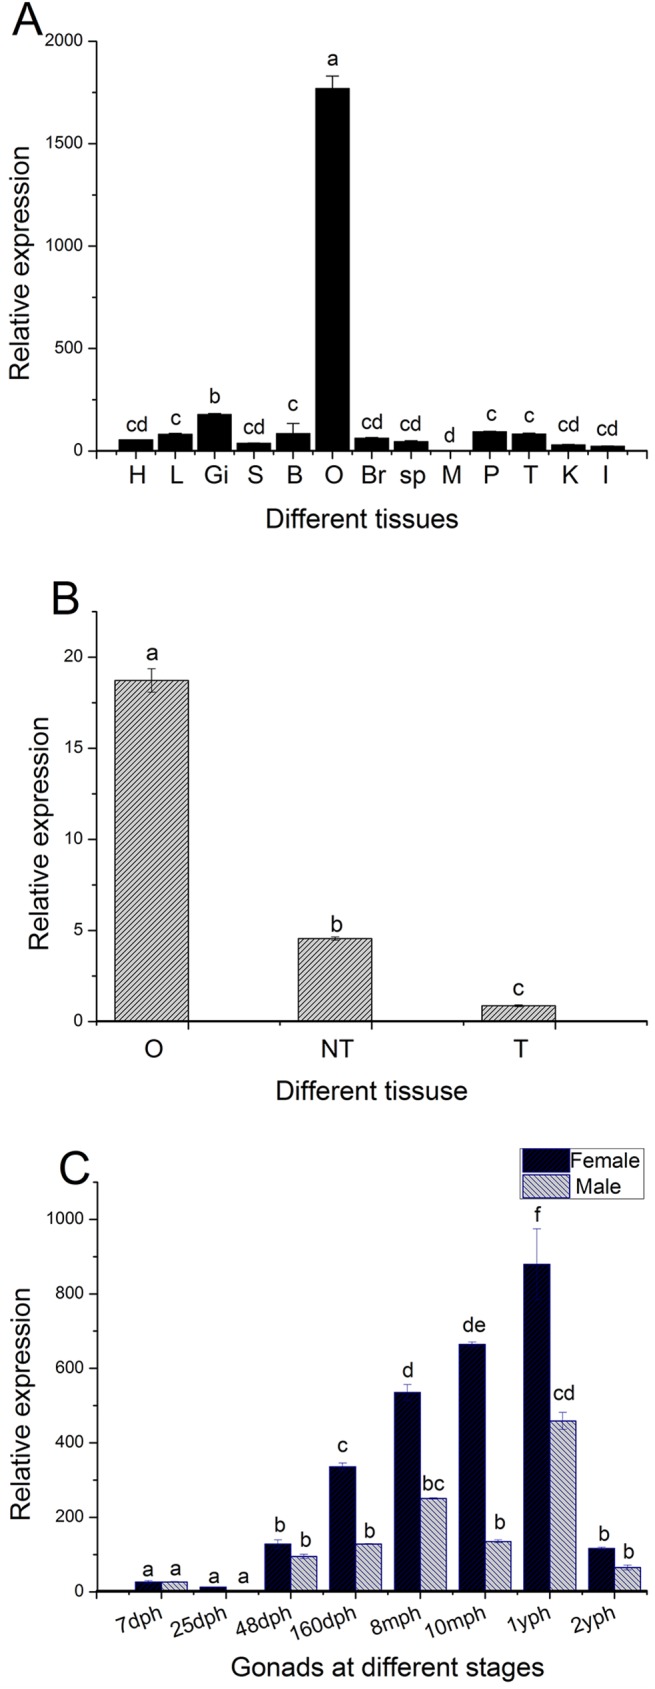
Fig 3. Expression levels of β-catenin1 mRNA in C. semilaevis evaluated with qRT-PCR.

(A) Expression of CS-β-catenin1 in various tissues. H: heart, L: liver, K: kidney, I: intestine, SP: spleen, S: skin, M: muscle, B: blood, Br: brain, Gi: gill, P: pituitary, O: ovary, T: testis. (B) Expression of CS-β-catenin1 in different genotypes. O: ovary, T: testis of males, NT: testis of neomales. (C) Expression of CS-β-catenin1 in gonads at different developmental stages. β-actin was used as an internal control to normalize the expression. Three samples were performed. Data are shown as means ± SEM. The variance of this expression was represented as a ratio (the amount of CS-β-catenin1mRNA normalized to the corresponding reference genes values). Values with superscripts indicate statistical significance (P<0.05)
