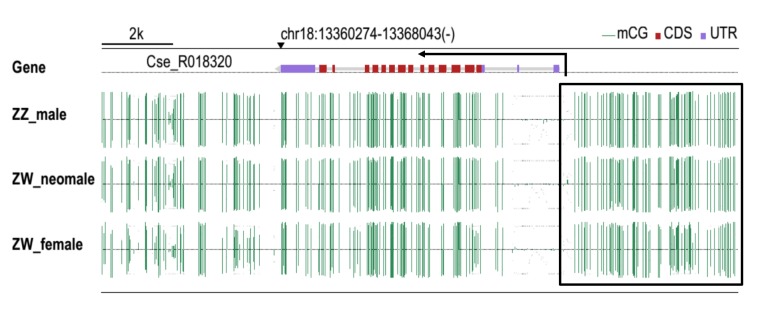
Fig 6. Methylation analyses of CS-β-catenin1 in gonads.
The CS-β-catenin1 genomic sequence with gene body, also the 2kb up-and downstream area was analyzed. The methylation level of cytosines is shown with green vertical lines. The boxed area indicated the not different significantly methylation sites distributed in the upstream of 5’UTR (about 2 kb) of CS-β-catenin1 gene. Arrows indicate direction of transcription.

