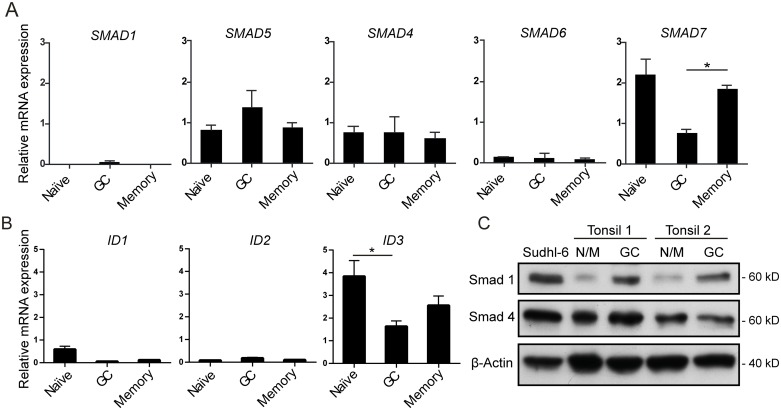
Fig 2. GC B cells have higher levels of r-Smads and lower levels of i-Smads as compared to naïve or memory B cells.
mRNA expression was determined by qPCR of FACS-sorted B-cell subsets from tonsillar specimens. (A) SMAD mRNA expression and (B) ID mRNA expression. Relative mRNA expression is shown relative to PGK-1 as endogenous control and normalized to total RNA from human fetal brain. Shown is mean values ± SEM, n = 3. (C) Protein levels of Smads were determined by western blotting of B-cell subsets obtained by immunomagnetic bead separation of tonsil single-cell suspensions. Sudhl-6 cells were included as positive control and β-actin was used as loading control. N/M denotes naïve/memory B cells. *p < 0.05, paired two-tailed Student’s t-test.

