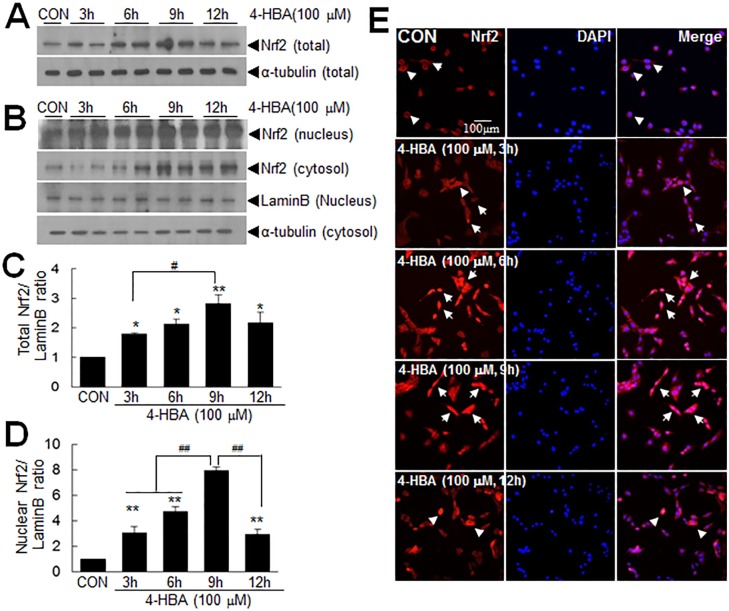
Fig 2. The up-regulation and nuclear translocation of Nrf2 by 4-HBA.
(A, B) C6 cells were treated with 100 μM of 4-HBA for 3, 6, 9, or 12 hrs and total (A) and nuclear and cytoplasmic Nrf2 levels (B) were determined by immunoblotting. (C-D) Total (C) or nuclear (D) Nrf2 levels are presented as means±SEMs (n = 3). *p<0.05, **p<0.01 versus untreated controls, #P<0.05, ## p< 0.01 between indicated groups. (E) Double fluorescent staining was performed using anti-Nrf2 antibody and DAPI. Nrf2-positive cells were identified using a rhodamine-conjugated secondary antibody. Arrows indicate Nrf2 translocation from cytoplasm to nucleus and arrowheads indicate the cytoplasmic localization of Nrf2. The photographs presented are representative of three independent experiments. The scale bar represents 100 μm.

