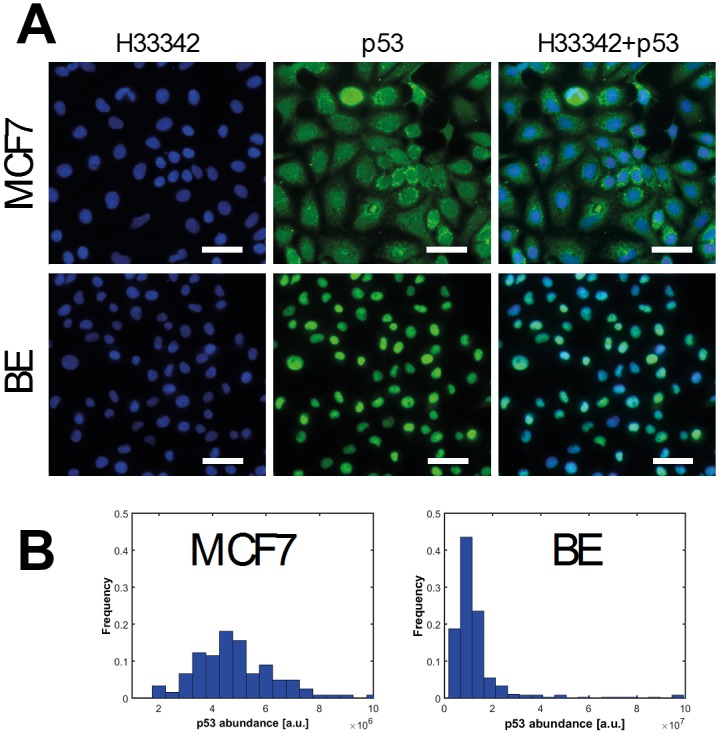
Fig 2. Results of single cell p53 immunofluorescence measurements.

(A) Representative raw immunofluorescence images of fixed MCF7 (top row) and BE (bottom row) cells. Cells were stained directly using mouse monoclonal α-p53 (DO-1) conjugated to Alexa Fluor 488 to visualise p53 protein (shown in green) and counterstained with Hoechst 33342 to stain the nucleus (shown in blue). Overlaid images show that the p53 antibody staining pattern is both cytoplasmic and nuclear in MCF7 cells, whereas in BE cells only the nucleus is stained. Scale bars 50μm. (B) Immunofluorescence images are processed and the p53 fluorescence intensity per cell is determined. Distributions of p53 fluorescence total intensity per cell for MCF7 (n = 122) and BE (n = 400) cells. Note the scale of arbitrary fluorescence units.
