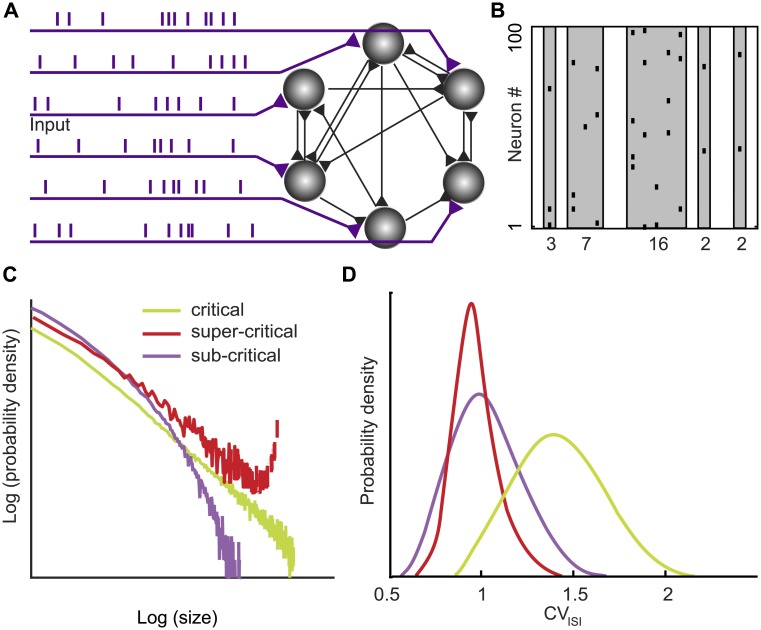
Fig 1. A quantification of the level of spike correlation in recurrent cortical circuits and its variation with external inputs is essential for understanding cortical computation.
(A) Schematic of a recurrent neural circuit consisting of neurons (gray), connections (black), and external inputs (purple). (B) Neuronal avalanches (gray) are contiguous bouts of spikes (black raster) across the recorded neurons. The spike count within an avalanche determines the avalanche size (numbers). (C) The shape of the avalanche size distribution reflects the level of spatiotemporal correlation within the network. A power law avalanche size distribution (straight line in the log log plot) is a characteristic feature of the critical (green) network state. Deviations from the power law distributions indicate the subcritical (purple) and supercritical (red) network state. (D) Theory predicts that operating near the critical network state impacts the variability of neuronal spiking as characterized by the coefficient of variation (CVISI) of the interspike interval (ISI). Specifically, irregular spiking (CVISI > 1) has been predicted to emerge at the critical network (green), whereas for the subcritical (purple) and the supercritical (red) network state the CVISI distribution peaks near 1.

