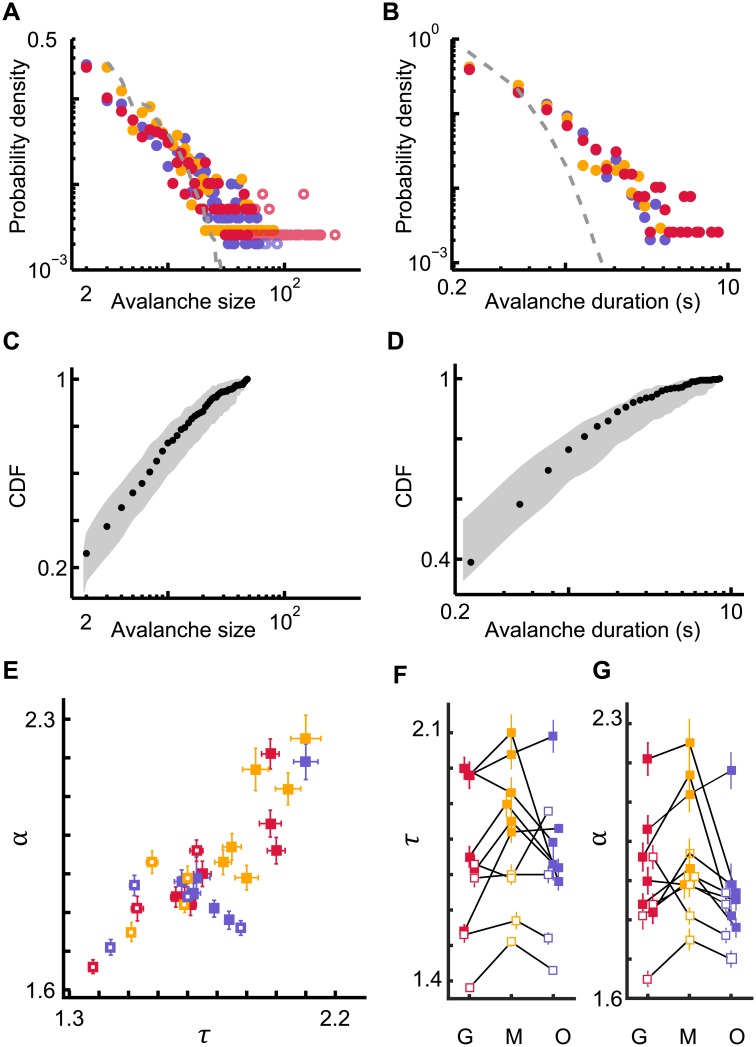
Fig 3. Avalanche size and duration distributions of cortical spiking activity for three different conditions of visual stimulation.
(A, B) Probability density functions for avalanche sizes and durations for the three stimulus conditions: grating (red), movie (yellow), and ongoing (blue). The solid dots denote the avalanches included for fitting to a truncated power law; open circles denote avalanches that were excluded in the fitting procedure (see Materials and methods). Shuffling spike times abolishes large avalanches and results in an avalanche size distribution (dashed gray lines) that is inconsistent with a power law. (C, D) Cumulative probability density function (CDF, black dots) of the experimental data from A and B. For visual comparison, the gray shading indicates the range (5–95%) of expected probabilities for the truncated power law with the same exponent as estimated from the experimental data and with the same number of samples. (E) Estimated avalanche size (τ) and duration (α) exponents for all mice and stimulus conditions for which the avalanche distributions fit power laws according to strict statistical criteria. (F, G) Estimated avalanche size (τ) and duration (α) exponents for the three stimulus conditions: grating (G), movie (M), and ongoing (O). Exponents from the same mouse are connected by black lines.

